I remember reading about weighted vs equal weighted.
Is QQQE the consensus go to index? Why this vs the S&P weighted index?
I remember reading about weighted vs equal weighted.
Is QQQE the consensus go to index? Why this vs the S&P weighted index?
I remember reading about weighted vs equal weighted.
Is QQQE the consensus go to index? Why this vs the S&P weighted index?
I’m the one singing the praises of QQQE…I wouldn’t call it any kind of consensus.
I’m a bit eccentric in my views.
Two reasons for my preference:
First, the statistical attractiveness of the businesses.
I use slightly different metrics for the two indexes, but I estimate that the rate of increase of old
fashioned earnings has been vastly better for QQQE for so long that some ongoing edge can be expected.
Other things being equal, you want to invest in the faster growing of two firms. (value growth, not price growth!) The same with indexes.
QQQE is equally weighted, so the median earnings yield is an excellent (and numerically stable) proxy for the average.
The median earnings (taking the median earnings yield and the no-dividend index level) has risen on trend at about inflation plus 7.2%/year to 8.2%/year since the late 1990s.
Those are astounding figures–on the order of three times the rate of GDP growth.
The earnings level dips in recessions, but (so far) promptly returns back to its prior trend.
The trend has been remarkably strong and steady since around 2005.
Since that’s the trend rate of earnings growth, that’s the trend rate of growth of the value of the index.
On top of that you get dividends, which average around 0.5%/year.
For the S&P, I came at the same question in a different way.
Given how much of the economy it covers, the short term variation comes almost entirely from the business cycle, not a few outlier firms.
Also, there are more data sources available.
So I just use a smoothing function on the real earnings to date.
That trend line has risen inflation plus 3.87%/year in the last 25 years.
Since that’s the trend rate of earnings growth, that’s the trend rate of growth of the value of the index.
On top of that you get dividends, which averaged around 2%/year in the last 20 years, only around 1.8% right now because of the high prices.
Side note: even that figure for earnings growth rate is an abnormally high rate compared to prior history…
net margins have really soared in recent years, a trend which can not continue.
Profits can’t grow faster than sales indefinitely–net margins are ultimately range bound and (very weakly) mean reverting.
So, the main case for QQQE being a better asset is simply that it rises in value more quickly.
The reasoning isn’t iron clad: it has in the past by a mile, surprisingly steadily and for 25+ years, so there’s a decent chance it will in future.
But it’s not a shocker–it has a lower representation from poor quality industries like (say) mines and construction firms.
And by construction there are no financial firms in it, so it is never hit by a financial panic.
And the second reason:
Separately, there is the issue of current valuation levels.
It’s a longer discussion, but the S&P 500 equal weight set is very much more expensive compared to
its history than the Nasdaq 100 is compared to its own history.
So one should expect a significant one-time gain to be had from getting on the Nasdaq train today, because there is no overhang of overvaluation.
Jim
How are you valuing the index?, I cannot seem to find any P to E data on it.
And the expense ratio is higher 0.35% vs 0.2% for the invesco equal weighted S&P I guess that’s small change. The invesco fund sits at 19.32 x earnings atm.
I remember reading about weighted vs equal weighted.
Is QQQE the consensus go to index?
Jim, per usual, has given an excellent reply. I will give a slightly different spin on QQQ vs QQQE. The cap weighted QQQ is already heavy in large cap stocks, including Apple, while QQQE has equivalent dollar amounts of all the stocks in the Nasdaq 100, regardless of cap. BRK is already pretty heavy in Apple. Buying the two Apple heavy shares increases risk due to a single stock. Some may be happy to do that, but one needs to be aware and do it intentionally.
FWIW,
IP
And the expense ratio is higher 0.35% vs 0.2% for the invesco equal weighted S&P I guess that’s small change.
0.2% is too high. Vanguard has a few S&P index funds or etf with expense ration at 0.04%
https://investor.vanguard.com/investment-products/mutual-fun…
“0.2% is too high. Vanguard has a few S&P index funds or etf with expense ration at 0.04%”
It costs a lot more to do all that trading when they reset back to equal weight each quarter.
QQQE is only 100 firms, so you could probably do it yourself. Be tempting to weed some “obviously” bad firms out, though. And that way lies madness…
QQQE is only 100 firms, so you could probably do it yourself. Be tempting to weed some “obviously” bad firms out, though. And that way lies madness…
Most brokerage firms now offer commission-free stock trade. So that’s feasible.
Most brokerage firms now offer commission-free stock trade. So that’s feasible.
You also need to be able to trade fractional shares – unless you have like a 7-digit portfolio.
M1Finance.
Or maybe IBKR (Pro?). Seems easier to just pay the 0.35% E/R.
M1 can do fractional and rebalance, easy and for free.
Has anyone considered/had experience with the iShares MSCI USA equal weighted index (EUSA)?
Focused on large and madcap companies (over 600 in portfolio now), it has a lower expense ratio (.09% vs .35% QQQE) and higher distributions (1.5% vs .5% QQQE). Has returned over 12% annually since inception in 2010.
https://www.ishares.com/us/products/239693/ishares-msci-usa-…
Would this be a worthy contender with QQQE or RSP?
0.2% is too high. Vanguard has a few S&P index funds or etf with expense ration at 0.04%
But they are essentially all capitalization weighed, and therefore they all have two problems:
QQQE’s largest single-company exposure is 1%.
QQQ’s largest single-company exposure is 11.3%.
In that sense, QQQ is 11 times the risk for the same set of firms.
Remember that the sole reason to invest in any index fund is to minimize company specific risk, so that’s not a meaningless metric.
It is my conclusion that the extra management fee is money very well spent to avoid those problems.
This is one instance that shaving the fees is a false, and dangerous, economy.
Separately, I hew strongly to this reasoning that suggests that nobody should invest in QQQ:
QQQ is so strongly concentrated in just a few names that the short and long run results are very much a function of how those few firms do.
The top six firms make up over 45% of that index. Top 3 are about 30%.
If you know those firms and their prospects well enough to believe in them, buy them, not an index that is heavy in them. So no QQQ.
If you DON’T know how to value the prospects of those few firms, you have no business investing in them in a heavily concentrated way. So no QQQ.
The same reasoning, to a somewhat lesser degree, applies to the cap weight S&P 500.
It’s the easiest and most common way to make a poor but conventional choice, and these days one of the easiest pitfalls to avoid.
Jim
How are you valuing the index?, I cannot seem to find any P to E data on it.
I have access to some very high quality historical data.
Partly leftovers from my days running a hedge fund, partly thanks to the efforts of some folks at the MI board.
They are somewhere between expert and obsessive in terms of database construction.
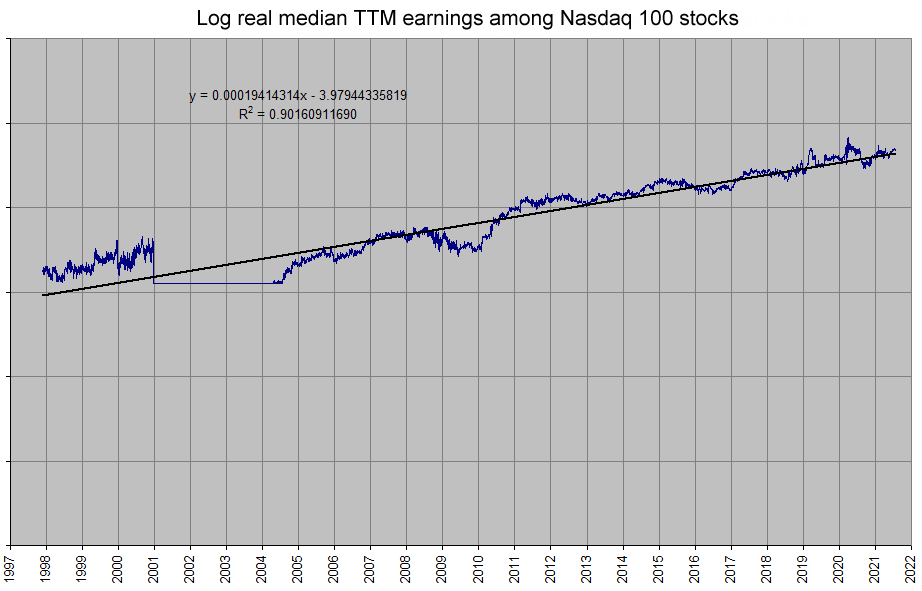
The main input to my model is the daily figure for the median trailing-four-quarters earnings yield among the 100 stocks.
Though obviously that’s cyclical, that makes a pretty good metric of valuation over time.
For an equally weighted index, median is a better representation of the average than the average itself, for subtle reasons I won’t go into.
With that, and the data series for the index, I estimate the earnings of the index on each day through history.
I don’t have the index level in the distant past, but I have a data series of the returns for the
Nasdaq 100 equal weight without dividends, which amounts to the same thing plus a constant multiplier.
This is a graph (about a year out of date) of what the result looks like: median real earnings through time for the 100 companies:
http://www.stonewellfunds.com/Nasdaq100_MedianRealE.png
As you can see, that’s not a randomly wandering line, it’s a surprisingly steady trend.
Re the flat spot: Earnings were understandably horrible in the tech bust, so I zapped those out.
This sounds like cheating, but it makes it more conservative…
if you include some very old very low values, it makes the slope of the trend line higher.
(Ignore the formula on the graph)
Plus, it will cause you to be more optimistic when you go to estimate the average long run multiple to get some idea of “normal”.
Jim
QQQE’s largest single-company exposure is 1%.
QQQ’s largest single-company exposure is 11.3%.
In that sense, QQQ is 11 times the risk for the same set of firms.
A quick check shows that QQQ outperformed QQQE over the past 10 years. Do I miss something?
This page has a chart and table for comparison:
https://www.inspiretofire.com/qqq-vs-qqqe/#:~:text=The%20mai….
A quick check shows that QQQ outperformed QQQE over the past 10 years. Do I miss something?
I don’t doubt it.
But that doesn’t change the case for QQQE, which is the fact that its value and its growth trajectory can be estimated, and to an extent extrapolated, unlike for QQQ.
Think of the returns of QQQ this way:
The random number has been positive lately.
Separately, that “random number” is very likely to be negative over the long run.
Historically, on average, the very largest firms are underperformers.
Fairly obviously, firms which are currently very overvalued are likely to be over-represented in that group of largest market cap stocks.
This means that with a cap weight grouping (or something similar to cap weight—QQQ isn’t cap weight),
on any given day more of your money is allocated to the overvalued, and less to the undervalued.
This causes a long run drag to performance.
But only on average. There can be multi-year streaks that it doesn’t work out that way.
See comment above about randomness.
Jim
Historically, on average, the very largest firms are underperformers.
Fairly obviously, firms which are currently very overvalued are likely to be over-represented in that group of largest market cap stocks.
This probably needs more studies. I think the Internet business differs from traditional business in important aspects: larger economic scale (not as much capital required), less structural bureaucracy and faster reaction to market.
Historically, on average, the very largest firms are underperformers.
Fairly obviously, firms which are currently very overvalued are likely to be over-represented in that group of largest market cap stocks.
…
This probably needs more studies. I think the Internet business differs from traditional business in important aspects:
larger economic scale (not as much capital required), less structural bureaucracy and faster reaction to market.
Internet companies are interesting economically, to be sure.
But beware the dangers of edging too far towards the narrative of “it’s different this time”.
Just because they’re big and profitable and have done well lately doesn’t mean they can’t be overvalued some of the time.
And in any case, I’m stating a generality over time, not something one can assume to be correct about specific stocks in a specific year.
An equally weighted portfolio of the 5 largest market-cap firms underperformed the S&P 500 by 3.79%/year in the 39 years to 2017, and remarkably consistently.
And of course there was such a thing as big successful tech firms during much of this stretch.
Since then, a little over 5 years, the top 5 have beat the S&P by 13.13%/year.
Is that because the world is different this time, or just the luck of the draw of the intersection of “big” and “strong stock performance”.
Is it different this time, or just one of those semi-rare stretches that the biggest happen do to well?
If I were picking an index fund to ride for the next 25 years, it wouldn’t be cap weighted.
For multiple reasons, but long run underperformance is a biggie.
If something just out of the top few gets overvalued, it will get up into the top few ranked by size.
That’s why it happens. And it certainly does happen–there are lots of papers on it.
Jim
ust because they’re big and profitable and have done well lately doesn’t mean they can’t be overvalued some of the time.
I haven’t looked at the smaller ones extensively. But those that have been mentioned on this board are more expensive than the well-known big ones, although with higher growth rate.
I’m the one singing the praises of QQQE…I wouldn’t call it any kind of consensus.
Compartmentalization is amazing. While disparaging Index investing, hunting for ephemeral advantage within the Index universe in obscure illiquid products… go figure.
iShares MSCI USA equal weighted index (EUSA)?
Would this be a worthy contender with QQQE or RSP?
Doesn’t look like it.
https://www.portfoliovisualizer.com/backtest-portfolio?s=y&a…
Between EUSA, QQQE, and RSP, QQQE has the best CAGR and Sortino ratio and MaxDD.
CAGRs of 11.74%, 15.68%, 12.75%
Between EUSA, QQQE, and RSP, QQQE has the best CAGR and Sortino ratio and MaxDD.
CAGRs of 11.74%, 15.68%, 12.75%
The past isn’t always the best guide to the future.
It’s also worth looking at what it is, how it’s constructed, and (yes) how much it costs.
As an example, sometimes something gets too expensive.
That makes the past look good and the future is likely to be bad.
So, probably better to look under the covers.
The obvious comparison is RSP.
Given the low volume and relatively low asset level, it might not survive?
But fees are low, and it doesn’t look crazy. Seems like 626 stocks.
FWIW, recent breakdown
Information Technology 17.09%
Financials 13.42%
Health Care 13.24%
Industrials 13.22%
Consumer Discretionary 9.66%
Utilities 6.34%
Real Estate 6.03%
Consumer Staples 5.86%
Materials 5.53%
Communication Services 5.15%
Energy 4.46%
Performance seems fine based on what I could find–
https://www.msci.com/usa-equal-weighted
Jan 1999 to July 2015 (last figures I could find with a quick search)
MSCI USA (cap weight conventional version): CAGR 4.30%
Equal weight: 7.69%
Eyeballing the chart, better in good times, worse in bad times.
I suppose there are more good times than bad times over the long haul.
Needs a closer look.
But at a quick glance, I don’t see a prominent reason to dismiss it.
Jim